Generating intermodal graph and calculating adjacency matrix
[8]:
import os
import geopandas as gpd

local_crs = 32636
example_data_path = "./data"
[9]:
from blocksnet import GraphGenerator, AdjacencyCalculator

blocks = gpd.read_parquet(os.path.join(example_data_path, 'blocks.parquet')).to_crs(local_crs)
intermodal_graph = GraphGenerator(territory=blocks).get_graph('intermodal')
Graph made for 'walk' network type
Graph made for 'bus'
Graph made for 'trolleybus'
Graph made for 'tram'
Graph made for 'subway'
[10]:
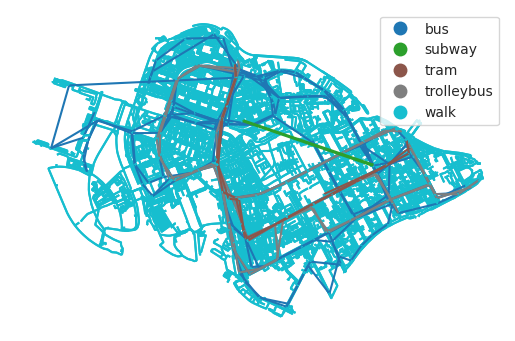
GraphGenerator.plot(intermodal_graph)
[11]:
adj_matrix = AdjacencyCalculator(blocks=blocks, graph=intermodal_graph).get_dataframe()
adj_matrix.head()
[11]:
| id | 0 | 1 | 2 | 3 | 4 | 5 | 6 | 7 | 8 | 9 | ... | 261 | 262 | 263 | 264 | 265 | 266 | 267 | 268 | 269 | 270 |
|---|---|---|---|---|---|---|---|---|---|---|---|---|---|---|---|---|---|---|---|---|---|
| id | |||||||||||||||||||||
| 0 | 0.0 | 9.1 | 17.6 | 24.0 | 17.3 | 18.9 | 25.6 | 12.1 | 28.0 | 14.5 | ... | 36.7 | 33.9 | 29.9 | 32.6 | 31.1 | 28.5 | 28.8 | 27.1 | 25.2 | 27.9 |
| 1 | 9.1 | 0.0 | 17.9 | 24.3 | 17.6 | 19.2 | 27.4 | 12.7 | 28.3 | 14.8 | ... | 40.9 | 38.1 | 31.9 | 34.6 | 33.1 | 30.5 | 30.8 | 29.4 | 27.2 | 30.2 |
| 2 | 17.6 | 17.9 | 0.0 | 11.4 | 0.6 | 6.3 | 15.9 | 12.5 | 15.4 | 13.1 | ... | 44.3 | 41.5 | 36.1 | 38.8 | 37.3 | 34.7 | 35.0 | 33.6 | 31.4 | 34.4 |
| 3 | 24.0 | 24.3 | 11.4 | 0.0 | 11.1 | 7.6 | 15.3 | 18.9 | 9.6 | 19.5 | ... | 50.7 | 47.9 | 42.5 | 45.2 | 43.7 | 41.1 | 41.4 | 40.0 | 37.8 | 40.8 |
| 4 | 17.3 | 17.6 | 0.6 | 11.1 | 0.0 | 6.0 | 15.6 | 12.2 | 15.1 | 12.8 | ... | 44.0 | 41.2 | 35.8 | 38.5 | 37.0 | 34.4 | 34.7 | 33.3 | 31.1 | 34.1 |
5 rows × 271 columns
[12]:
adj_matrix.to_pickle(os.path.join(example_data_path, 'adjacency_matrix.pickle'))